Carla Januska is the founder and chief creative officer of Smart Hive. She is a creative strategist, director, and designer focused on creating visualizations that communicate to and engage. She uses data visualization, information design, graphic design, UX, illustration, and code to better tell the stories that brands and organizations ought to communicate. Visualization is the number one way we show our audiences who we are and what we do and Carla has over 20 years of experience bringing brands to life with visualization and design.
Smart Hive is Carla Januska’s data visualization agency, launched in 2013. Part of Carla’s task is to educate her prospective clients on data visualization, sometimes called data viz. You might know data viz’s simpler cousin, the ubiquitous infographic.
Visualization creates understanding and facilitates clear communication. And it’s required in today’s overstimulating world of complex ideas, complicated structures, abstract strategies, massive data, and innovative ideas. Your brand needs to tell the truth—and data visualization leverages your data to build trust with your customers.
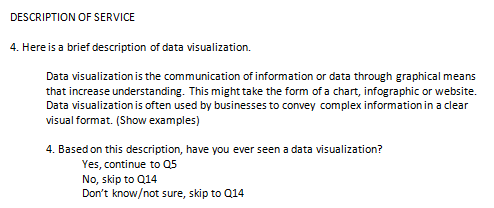
In the summer of 2013, I invited Carla to participate in one of my pilot projects. She was in the process of launching her new agency, so the timing was perfect. Our research objectives were to find out if people knew what data viz was, find out what they knew about data viz, describe it to them if they didn’t know anything about it, try to figure out how they felt about it, and then find out the likelihood that they would hire a professional to do data viz for them. Here is how we started. Visually! Of course.
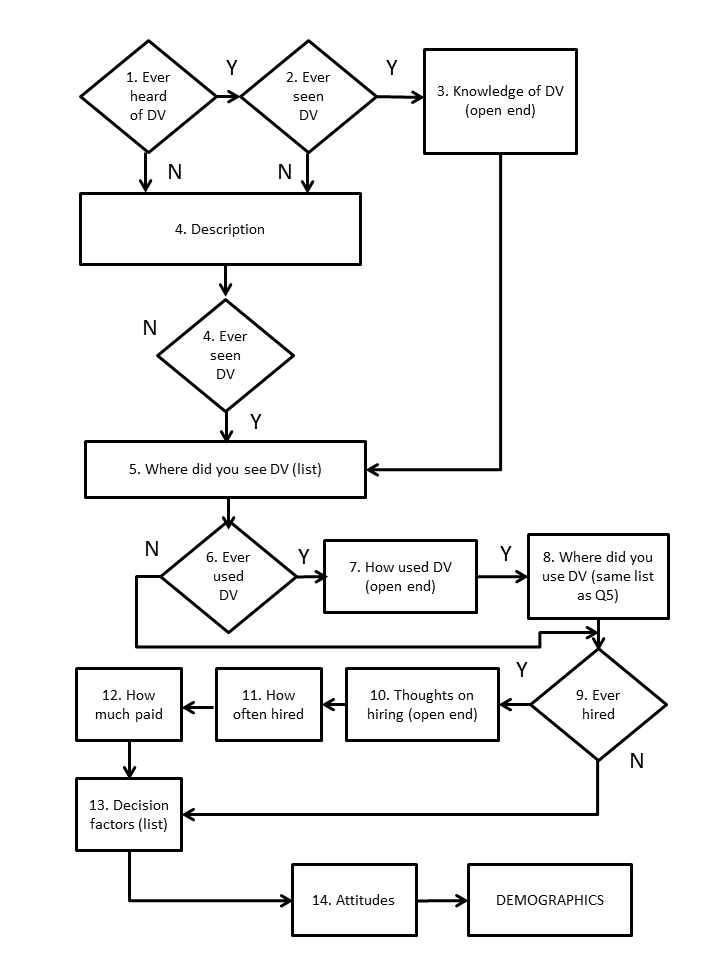
Together, we wrote the question set, and with Carla’s approval, I put the questions into a Google form. Carla emailed the form link to her email list. Within a few days, we received 44 responses, with another 10 responses trickling in over the remainder of the month.
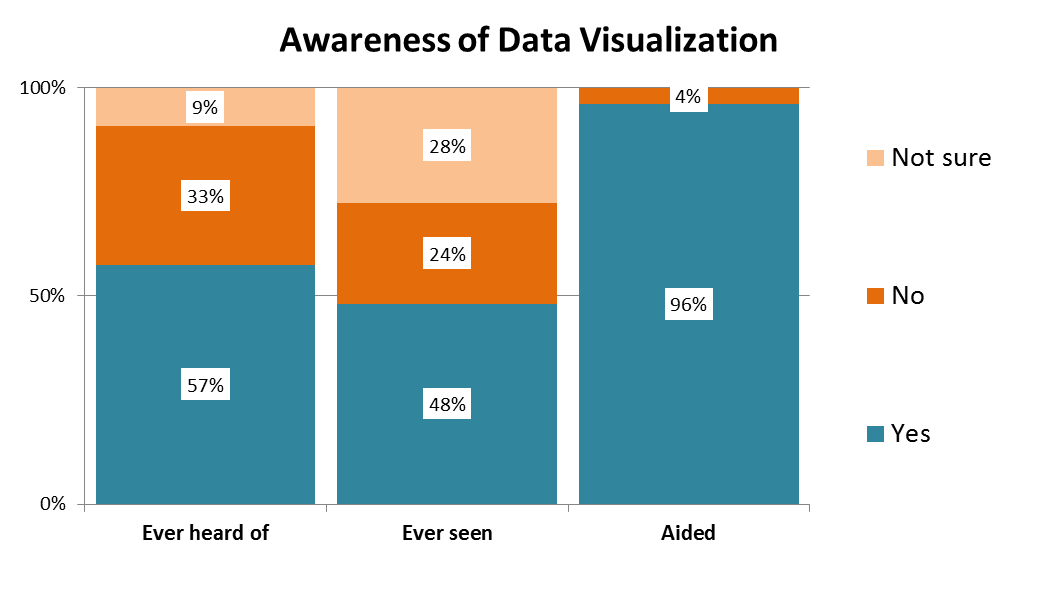
Many (57%) of the participants had heard of data visualization, although a smaller percentage (48%) indicated they had seen data viz. Once we showed them images of infographics and offered them a short description of data visualization, the percentage of people who had seen a data viz jumped to 96%.
65% said they had created, developed, or used data viz in some way in their work. Only 19% said they had hired someone to create a data viz for them.